Report on Greenhouse Gas Emissions during Fiscal Year 2010
Summary: As of FY10, Williams is over 60% of the way toward reaching our greenhouse gas emissions goal of 10% below 1990’s level by 2020.
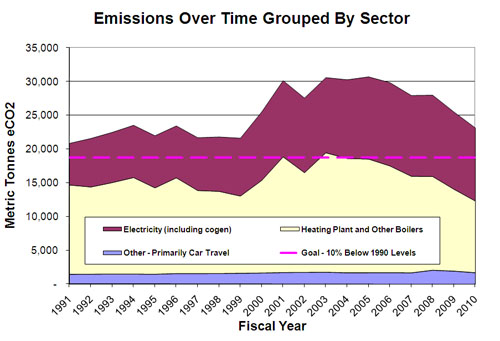
These emissions were approximately 21,000 metric tonnes eCO2 in 1990/91. They increased to approximately 31,000 metric tonnes in FY05 due to added buildings and increased energy use in existing buildings. Concerted efforts to reduce energy consumption and emissions starting in FY07 have lowered annual emissions to 23,136 tonnes in FY10.
FY10: Emissions in FY10 were down 9% from the previous year and 25% from peak emissions in FY05. See Figure 1 and Table 1.
| Fiscal Year | Total Emissions (metric tonnes eC02) | % Decrease from Previous Year | % Decrease from Peak in FY05 |
| 2005 | 30,696 | – | – |
| 2006 | 29,842 | 2.8% | 2.8% |
| 2007 | 27,931 | 6.4% | 9.0% |
| 2008 | 27,938 | 0% | 9.0% |
| 2009 | 25,493 | 8.8% | 17.0% |
| 2010 | 23,136 | 9.2% | 24.6% |
Table 1: Total emissions and percentage decreases by fiscal year
Figure 2, Emissions and Effects of Actions on Business as Usual, (below) highlights the results of emissions reduction initiatives. The solid black line (above the yellow wedge) is our best estimate of what emissions would have been had we not taken action – our “business as usual.” Each wedge represents the effects of a different category of initiatives. Actual emissions are indicated by the solid pink line.
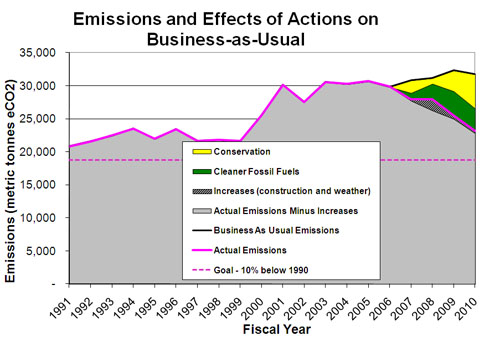
Sources of Reduction:
- Cleaner Fossil Fuels (green wedge): Using more natural gas at the central heating plant accounted for approximately 37% of total emissions savings in FY10 while the switch to B10 oil accounted for 2%.
- Use of additional natural gas at the heating plant: The central heating plant can burn natural gas or residual oil. Natural gas emits about 35% less greenhouse gas per heating unit than residual oil, but is often more expensive. In FY10, 96% of heating fuel used was natural gas, compared to 43% in FY07.
- Use of B10 instead of distillate oil (home heating oil): Most buildings on campus are heated by steam supplied by the central heating plant. Some buildings that are far from the center of campus have their own individual boilers, and many buildings have small boilers to provide hot water during the summer when the heating plant is shut down. All of the individual boilers normally burn distillate oil. In FY10, Williams burned B10 in all of those individual boilers during some months of the year. B10 is a 10%/90% mix of biodiesel and distillate oil. It can be burned in place of distillate oil with no changes in equipment, though it does cost more than ordinary distillate oil and tends to require more frequent filter changes.
- Conservation Projects (yellow): In FY10, energy conservation measures accounted for approximately 60% of total emissions reductions. Total campus energy use has decreased 13% from the peak in FY05.
- Winter Shutdown: From Dec. 24, 2009 through Jan. 2, 2010, Williams closed the campus, and encouraged students, faculty and staff to turn off and unplug all lights, refrigerators, printers, computers, etc. before leaving. Building temperatures were turned down significantly. Williams saved an estimated 528 tonnes of emissions in these 10 days.
- Morley Science Labs: A comprehensive energy saving program at MSL has been in progress for over two years. The energy savings began in FY09 and continued in FY10. Electricity use in MSL is down 8.5% from last year and 32% from its peak in FY06. Considering that MSL is the single largest user of electricity on campus (accounting for over 10%), these savings alone equate to a 3% reduction in total campus electricity. Steam metering was installed in MSL (and many other campus buildings) part way through the FY10 heating season; information from those meters will be helpful in analyzing the impact of current and future conservation projects on steam usage.
- Building controls, night setbacks, central plant efficiencies: The Facilities Office continued to use the campus-wide building management system to establish and fine tune setbacks for night and other unoccupied times in many buildings, leading to energy savings. Seasonal switchovers at the central heating plant and central chiller were accomplished more efficiently. Finally, many individuals and departments across campus have worked to decrease their energy use.
What we did well last year, and challenges for the future:
Student, faculty and staff attention to energy conservation and the college’s work on conservation projects have resulted in energy savings in many buildings on campus and at the central plants. Several of the large energy conservation initiatives that have been in progress (such as the Morley Science Labs retro-commissioning) are now yielding significant energy savings. This first round of energy conservation projects represent the “low-hanging fruit” Additional projects are being identified that may be more challenging to implement or produce savings at a lower rate. These projects will require continued commitment to resources (both capital and personnel) to accomplish them.
The increased proportion of natural gas used at the heating plant represents a large portion of the decrease in emissions. Similar (or lower) levels of emissions from the heating plant (whether through burning of natural gas or some other relatively clean fuel) are necessary in future years if Williams is to meet its goal.
Only a small portion of Williams’ total energy (<1%) comes from renewable sources. One or more large-scale renewable energy projects will likely be necessary to reach the emissions goal. As we approach that goal, established in FY07, Williams may wish to consider whether deeper emissions reductions are warranted.