Summary: Williams’ greenhouse gas emissions were approximately 21,000 metric tonnes eCO2 in 1990/91. These emissions increased to approximately 30,000 metric tonnes in FY01 due to new construction and increased energy use in existing buildings and have remained at that level until FY06. Concerted efforts to reduce energy consumption and emissions resulted in significant decreases in FY07 that were maintained through FY08, bringing Williams closer to its goal to reduce emissions to 10% below the 1990/91 level by FY20.
Emissions in 2008 were approximately 21,848 metric tonnes of eCO2, down from approximately 22,036 metric tones in fiscal year 2007, a decrease of 1%.
(Emissions from fiscal year 2007 and Williams’ emissions goal differ slightly from those reported last year – emissions reported here were determined using the latest version of a calculator provided by Clean Air Cool Planet, while those reported last year were calculated using a previous version.
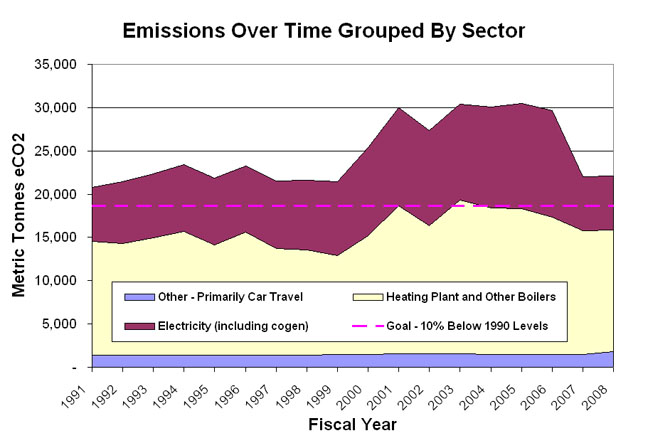
Figure 2, Emissions and Effects of Actions on Business as Usual (below) highlights the results of emissions reduction initiatives. The sum of the colored wedges (the top of the yellow wedge specifically) is our best estimate of what emissions would have been had we not taken action – our “business as usual” estimate. Each wedge represents the effects of a different category of initiatives. Actual emissions are indicated by the pink line.
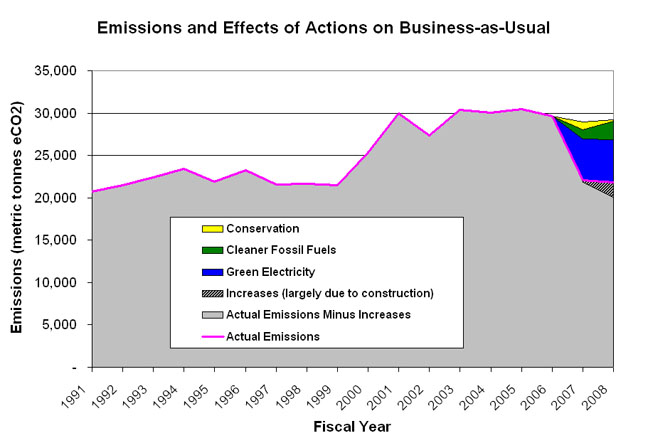
Figure 2: Emissions from Fiscal Year 1991 to 2008, showing effects of reductions measures on business-as-usual.
Sources of Reduction and Increase:
- Electricity Purchase (blue): Starting in the spring of 2006, Williams began purchasing electricity from Transcanada, an electricity provider that uses a substantial portion of large-scale hydro power. Approximately 70% of emissions reductions were due to the purchase of cleaner electricity, clearly the largest contributor to overall reductions.
- Cleaner Fossil Fuels (green): Using more natural gas at the central heating plant accounted for approximately 31% of total emissions savings, while the switch to B5 accounted for 1%.
- Use of additional natural gas at the heating plant: Williams’ central heating plant can burn either natural gas or residual oil. Natural gas emits about 35% less greenhouse gas per heating unit than residual oil, but is often more expensive. In FY08, 64% of heating fuel used was natural gas, compared to 43% in FY07, although more heating fuel in total was consumed in FY08. In FY08, natural gas cost less per unit of energy than it did in FY07, so this switch lowered costs as well as emissions.
- Use of B5 instead of distillate oil: Most buildings on the Williams campus are heated by steam supplied by the central heating plant. Some buildings that are far from the center of campus have their own individual boilers, and all buildings have small boilers to provide hot water during the summer when the heating plant is shut down. All of the individual boilers normally burn distillate oil (home heating oil). In FY08 (as in FY07), Williams burned B5 in all of those individual boilers. B5 is a 5%/95% mix of biodiesel and distillate oil. It can be burned in place of distillate oil with no changes in equipment, though it does cost more than plain distillate oil and tends to require more frequent filter changes.
- Conservation Projects and the impact of energy used during construction of the North and South Academic Buildings (yellow): In FY08, energy conservation measures accounted for approximately 2.5% of total emissions reductions. These savings were somewhat reduced by the additional energy used during construction projects and increases in energy consumed in some buildings. For example, Lasell Gymnasium’s electricity use increased 36% from FY07 to FY08, most likely due to the creation of the new fitness center, with its attendant lighting, ventilation, and equipment.In Figure 2 (above), the estimate of energy used during construction is represented by the grey dashed area. In the Figure 3 (below), the estimated construction related emissions (from both electricity and steam from the heating plant) have been removed, so that we can better see the impacts of conservation projects.
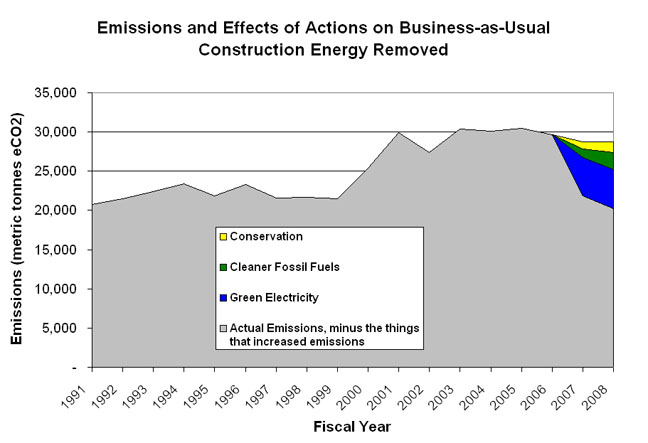
Figure 3: Greenhouse Gas Emissions from fiscal year 1991 to 2008, with the impacts of reductions measures on business-as-usual.

Facilities has been working steadily on conservation projects across campus, including a large number in Morley Science Center, Williams’ single largest user of electricity. In FY08, electricity use in Morley was down five percent from FY07 (and 7% between FY07 and FY06). Similar results have occurred in other buildings: from FY07 benchmark Hopkins Hall was down 14%, Chapin Hall 19%, and Thompson Chapel 13%.
In addition, nearly three quarters of all dorms on campus showed a decrease in electricity use. Williams has been installing real-time electricity meters on buildings across campus, and records monthly electricity data for all campus buildings. This allows us to track electricity use with a reasonable amount of accuracy, and to estimate the effects of conservation efforts on electricity. Unfortunately, steam use in individual buildings is not currently metered, so the impacts of individual conservation projects on emissions from the heating plant cannot be determined. Fuel burned at the heating plant accounts for nearly 60% of total campus emissions, so projects that decrease those emissions would be especially valuable to track. Part of our sustainability initiatives include installing steam meters in campus buildings.
What we did well this year, and challenges for the future:
As in last year, a large portion of emissions reductions were due to Williams’ purchase of electricity from Transcanada, a provider that uses a high percentage of large scale hydro power compared to other providers in the region. We cannot rely on achieving these reductions in future years and these emissions reductions do not reflect a decrease in energy use. On the other hand by requiring our electricity suppliers to include their emissions portfolio in their bids, we send a message to the market that renewable electricity is a valued commodity, and indirectly encourage the development of new renewable energy.,
In addition, Williams is increasingly investing in on-site renewable energy technologies, such as a 27.8 kW photovoltaic array installed at the beginning of FY09 on the new off-site library shelving facility, but those installations have yet to account for a significant percentage of annual energy use.
Student, faculty and staff attention to energy conservation and the college’s work on conservation projects made a clear difference in electricity use in many buildings on campus. In FY08 several conservation projects were initiated, the full impact of which will likely not be seen until the coming year. It is expected that results from conservation efforts will continue to move us toward our goal. However, the work that is being done in energy conservation is being offset by several other factors that increase energy use. It appears that energy used during the construction of the North and South Academic buildings largely offset gains made through conservation in the current fiscal year. Improved monitoring of construction related energy consumption will help us to better quantify these effects.
While it is tempting to ignore construction energy use as a one-time-only cost of a building project, Williams undertakes construction and renovation projects on a regular basis. Furthermore, the additional daily energy consumption in the new or renovated buildings post-construction will be reflected in future year’s emissions, so even greater conservation efforts will be necessary to offset those increases. A concerted effort to design and construct energy efficient buildings will help minimize the impact of new construction and renovation projects.