Summary: Greenhouse gas emissions in 2009 dropped 10% from 2008 levels to approximately 19,600 metric tonnes of eCO2.
In 1990/91 Williams’ greenhouse gas emissions were approximately 21,000 metric tonnes annually. These emissions increased to approximately 30,000 metric tonnes in 2001, (43%) due to expanding the campus and increasing energy use in existing buildings. Emissions remained at that level until FY06. Concerted efforts to reduce energy consumption and emissions resulted in significant decreases in FY07 that were maintained through FY08, and further significant decreases in FY09, bringing Williams closer to its goal to reduce emissions to 10% below the 1990s level by FY20.
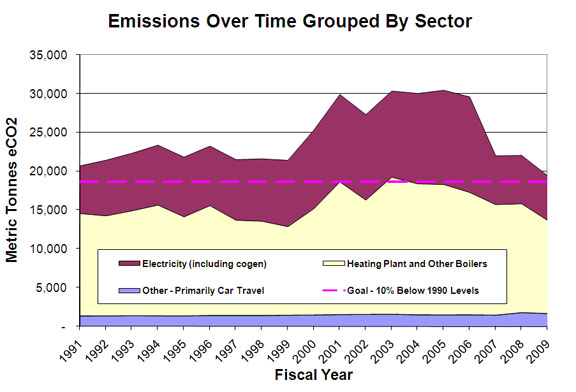
Figure 2, Emissions and Effects of Actions on Business as Usual (below) highlights the results of emissions reduction initiatives. The solid black line is our best estimate of what emissions would have been had we not taken action – our “business as usual” estimate. Each wedge represents the effects of a different category of initiatives. Actual emissions are indicated by the pink line.
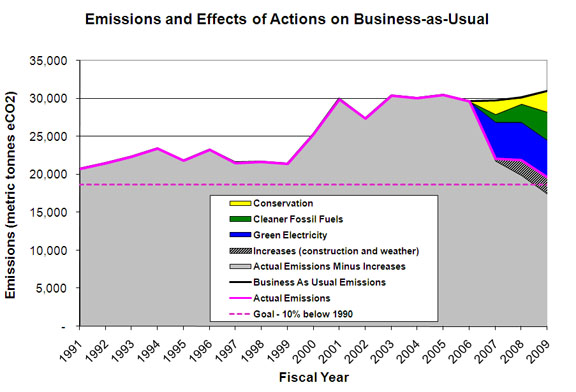
Sources of Reduction and Increase:
- Electricity Purchase (blue): Starting in the spring of 2006, Williams began purchasing electricity from Transcanada, an electricity provider that uses a substantial portion of large-scale hydro power. Approximately 52% of emissions reductions were due to the purchase of cleaner electricity, clearly the largest contributor to overall reductions.
- Cleaner Fossil Fuels (green): Using more natural gas at the central heating plant accounted for approximately 37% of total emissions savings, while the switch to B10 accounted for 2.5%.
- Use of additional natural gas at the heating plant: Williams’ central heating plant can burn either natural gas or residual oil. Natural gas emits about 35% less greenhouse gas per heating unit than residual oil, but is often more expensive. In FY09, 92% of heating fuel used was natural gas, compared to 43% in FY07.
- Use of B10 instead of distillate oil: Most buildings on the Williams campus are heated by steam supplied by the central heating plant. Some buildings that are far from the center of campus have their own individual boilers, and many buildings have small boilers to provide hot water during the summer when the heating plant is shut down. All of the individual boilers normally burn distillate oil (home heating oil). In FY09 (as in FY08), Williams burned B10 in all of those individual boilers during some months of the year. B10 is a 10%/90% mix of biodiesel and distillate oil. It can be burned in place of distillate oil with no changes in equipment, though it does cost more than plain distillate oil and tends to require more frequent filter changes.
- Conservation Projects (yellow): In FY09, energy conservation measures accounted for approximately 27% of total emissions reductions.
- Winter Shutdown: From December 24, 2008 through January 2, 2009, Williams asked all faculty and staff to stay home, and encouraged students, faculty and staff to turn off and unplug all lights, refrigerators, printers, computers, etc. before leaving. Building temperatures were turned down significantly, and Williams saved an estimated 300 tonnes of emissions in the 9 days of the shutdown. In addition, the campus community learned and maintained some new habits as a result of the shut-down. For example, after the shutdown, the librarians at Sawyer Library started to only turn on a few computers in the morning, and left others off until patrons chose to turn them on.
- Morley Science Center: A comprehensive energy saving program at Morley Science Center has been in progress for a year and a half, but the savings were largely realized in FY09. Electricity use in MSL is down 17% from last year, and considering that MSL is the single largest user of electricity on campus, that translates to a noticeable reduction in total campus electricity. While we don’t have a way of metering steam usage in MSL, some of the conservation projects were targeted at steam usage, and we can presume that some of the decrease in overall heating at the central plant was due to these projects.
- Lighting, night setbacks, behavioral changes: Lighting upgrades and occupancy sensors were installed in many buildings across campus, and several of those buildings (Bronfman Science Center and Lasell Gymnasium) showed significant decreases in electricity use from last fiscal year to this one. Facilities continued to establish and fine tune night setbacks in many buildings, leading to energy savings. The Paresky Center, for example, had a 17% decrease in electricity use from FY08 to FY09. Finally, many individuals and departments across campus have worked to decrease their energy use.
- 4. Sources of increase, largely weather related (dashed grey): FY09 was significantly colder than the ten year average (approximately 600 more heating degree days than expected), which makes the decrease in energy use at the heating plant even more significant and encouraging. Had FY09 been as warm as the ten year average, our emissions would have likely been another 1,000 – 1,800 metric tonnes lower.
What we did well this year, and challenges for the future:
As in last year, a large portion of emissions reductions were due to Williams’ purchase of electricity from Transcanada, a provider that uses a high percentage of large scale hydro power compared to other providers in the region. We cannot rely on achieving these reductions in the same manner in future years and these emissions reductions do not reflect a decrease in energy use. Williams has been steadily working to increase our on-campus or local renewable energy options, and further work in this direction will be necessary for meeting our goal.
Student, faculty and staff attention to energy conservation and the college’s work on conservation projects made a clear difference in energy use in many buildings on campus and at the central heating plant. Several of the large energy conservation initiatives that have been in progress (such as the Morley Science Center conservation program) are now yielding significant energy savings. There are more energy conservation projects currently underway, which suggests that there will be further savings next year.
The increased purchase of natural gas at the heating plant was a large portion of the additional decrease in emissions in the current fiscal year. Similar (or lower) levels of emissions from the heating plant (whether through burning of natural gas or some other relatively clean fuel) are necessary in future years if Williams is to meet its goal.