For the second year in the college’s experiment, we closed our doors on December 24th, shuttered up buildings, turned down the heat, turned off computers, refrigerators, photocopiers, and all sorts of other electrical equipment in an effort to save energy, minimize spending on utilities, and reduce greenhouse gas emissions during a relatively slow period in the academic calendar. When the doors to the campus opened again on January 4th, the college had succeeded in saving $100,000 in avoided utility costs; 430,000 kilowatt hours of electricity; and 4,840 million British Thermal Units of heating energy. To give an understanding of scale, about 2600 houses would use this amount of electricity in a 10 day period.
This avoided energy use represents 528 metric tonnes of greenhouse gas emissions (GHG), a 26% increase in emissions savings compared to last year, and 2.7% of FY09 total annual emissions of 19,600 tonnes.
See Table 1. Energy, Emissions and Costs Savings for FY09 and FY10 for more information on savings this year and last. ( Last year we erroneously reported emissions savings at 287 tonnes, adjusted values for FY09 are noted in the Table 1 as well.)
Overall, energy saving was 19% better than last year’s shutdown, after adjusting for outdoor temperature conditions. Financial savings were 9% better than previous year. Fuel prices are lower this winter: $10 compared to $12 per million BTU of combined fuels (residual oil and natural gas) burned at the heating plant, which explains why financial savings are disproportionately lower than energy savings. Number 2 oil, used in smaller campus buildings, is also considerably cheaper this year, as is electricity.
Table 1. Energy, Emissions and Costs Savings for FY09 and FY10
|
|
FY09 |
FY10 |
% increase from FY09 to FY10 |
|
|
MAIN CAMPUS |
|
|
|
|
|
Electricty |
(kWh) |
371,789 |
419,542 |
13% |
|
|
Unit cost ($/kWh) |
0.1128 |
0.1035 |
-8% |
|
|
Savings |
$ 41,946 |
$43,409 |
3% |
|
|
GHG (tonnes) |
152 |
172 |
13% |
|
|
|
|
|
|
|
Heat |
(mmBTU) |
3263 |
4070 |
25% |
|
|
($/mmBTU) |
11.99 |
10.06 |
-16% |
|
|
Savings |
$39,119 |
$40,951 |
5% |
|
|
GHG (tonnes) |
238 |
297 |
25% |
|
|
|
|
|
|
|
SMALLER BLDGS |
|
|
|
|
| Savings |
$10,500 |
$15,500 |
47% |
|
|
|
Energy (mmBTU) |
387 |
810 |
109% |
|
|
GHG (tonnes) |
29 |
59 |
100% |
|
|
|
|
|
|
|
Total |
Savings |
$91,600 |
$99,900 |
9% |
|
Total Emissions |
GHG (tonnes) |
420 |
528 |
26% |
|
Total Energy |
(mmBTU) |
4,977 |
6,378 |
28% |
Because of increased time for planning and better communication through a new Shutdown website, things in general went more smoothly compared to last year. To reduce the need to physically visit vacant buildings, we had installed wireless remote temperature sensing equipment earlier in the year to replace red lights that are typically used in these buildings to indicate low temperatures.
There were a one or two hiccups. A few heat related incidents called tradespeople back to campus. Morley Science Center didn’t go into cooling mode as it did last year, but we still have work to do improving the control of fans and occupancy sensors to get better performance from that building. Meanwhile, lights in Paresky remained on due to some struggles with the lighting control system.
Currently, we have metering in buildings only for electricity. These meters provide the ability to monitor energy consumption on a building by building basis. We are working on installing steam metering systems in individual buildings so that we can evaluate heat energy use too. That system should be up and running soon.
Highlights of building electricity use performance:
- Dorms were down an average of 51% from a baseline earlier in December, with the greatest decrease being 93%!
- All other buildings were down an average of 44% from the baseline, with the greatest decrease being 88%.
- Our largest electricity users also did well: Morley was down 20%, Jesup 14%, ‘62 CTD 58%, Paresky 46%, and Sawyer 78%. All of these showed improvements over last year.
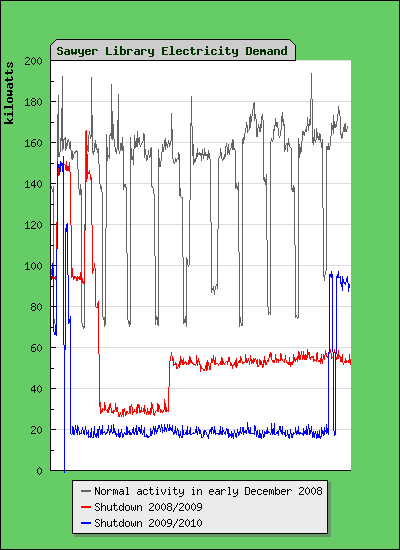
Sawyer Library performed even better than last year. While it is difficult to determine the exact reasons for the low energy use, diligent efforts on the part of library staff to turn off equipment is a significant contributor. The chart above, visually demonstrates the electricity use in Sawyer Library on a typical week in December, and during the shutdown periods last year and this year.
There were some as yet unexplained incidents with equipment during the break. One of the 10,000 or so sprinkler heads on campus failed causing water damage in Schapiro Hall and a couple of incubators and other small equipment have failed to start up properly after the break. There is no evidence yet that these were related to the shutdown but as we learn more about them we will let you know.
If you are interested in more information on calculation methodology, please contact Stephanie Boyd, at sboyd@williams.edu.